




Introduction
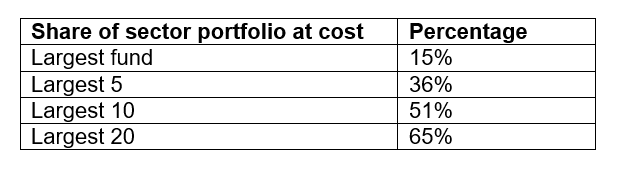
Most of the attention in business development company (BDC) land goes to the publicly traded names, which make up less than a third of the entity count, and the largest 10 names that hold just over half of the sector portfolio at cost. Whether this sample fairly characterizes the sector matters to fund lenders because BDCs provide a window into private credit trends, BDCs frequently appear as borrowers in subscription, NAV, and related financing, and because BDCs are significant LPs in subscription borrowing bases.
The SEC Business Development Company Data Sets aggregate filing data monthly for all electing BDCs: listed BDCs, perpetual non-traded BDCs, institutional private BDCs and small venture-lending vehicles. Drawdown direct lending funds, which generally do not register at all, credit interval funds, and other registered closed-end funds, which register under section 8 and generally report through a different set of forms, and are not included in the data. Most funds also file a schedule of investments, a position-by-position listing of every holding that allows for portfolio-level analysis.
The barrier to entry is analytical capacity. The current data set spans 2,205 fund-quarter observations across 202 entities, drawn from roughly 7.5 million typed numeric facts. The schedule of investments data covers 1.61 million raw rows across 407 columns, resolving to 3.79 million field-level observations.
Timing is also a consideration. Companies file a Form 10-Q up to 45 days after quarter end and a Form 10-K up to 90 days after fiscal year end, which means Q1 financial reports land in May and Q2 in August. SEC bulk data for the BDC sector is then compiled on a monthly basis, which positions this report as a preview to the Q2 industry aggregate data that will become available in the next few weeks.
The Sector
BDCs held $573 billion of assets at the end of the first quarter across 179 funds. Robust growth—the sector has more than doubled in three years—has been powered by non-traded funds, with rising concentration among funds over time. Net assets, or total assets less total liabilities, of non-traded funds more than tripled from Q1 2023 to Q1 2026. Their share of the sector portfolio at cost rose to 68% from 46%.
Within both segments, traded and non-traded funds, net assets and portfolio cost grew at almost the same rate over the three-year period: listed funds moved up 26% on each measure and non-traded expanding 224% at cost against 228% in net assets. Until 2026, the sector's expansion was funded proportionally between debt and equity.

The sector is concentrated. The ten largest funds, dominated by non-traded vehicles, hold half the sector portfolio at cost. Concentration is equally visible in the traded and non-traded segments, with the top five entities holding about half of the listed portfolio and about half of the non-traded portfolio.
Balance Sheet Trends in 2026
Sector growth has effectively stalled in 2026, and both the traded and non-traded segments have increased leverage, albeit by different routes. Total BDC assets reached $573.3 billion in Q1 2026, up a meager $2.15 billion (0.4%) on the quarter, versus increases of $25.6 billion in Q1 2024 and $33.6 billion in Q1 2025.
Continuing funds, meaning funds present in both the current and prior quarter, added only $0.62 billion as most of the reported growth came from new entrants net of exits. Five funds entered the reporting data and added $2.75 billion in total assets, while three exits removed $1.22 billion. The stall in growth at continuing funds marks a break from the prior two years when these funds supplied most of the asset growth.
Among continuing funds, contraction was widespread and led from the top. Nearly half, or 47.7% of these, held fewer assets at quarter-end than three months earlier, against 32.5% a year ago and 26.0% the year before. The 10 largest funds by opening size removed $1.20 billion between them even as the median fund grew assets by 0.6%. This reversed the 2024-2025 trend in which aggregate growth ran 4 to 5 percentage points above the median.
Net assets across continuing funds fell 1.1%, or $2.95 billion, while total assets ended roughly unchanged. In other words, Q1 results showed a greater reliance on debt. Both listed and non-traded segments ended the quarter at the highest assets-to-net-assets ratios in the available window.
Despite headline attention to redemption pressure at non-traded funds, the asset contraction has been led by listed funds. The Q1 decline at listed funds was broad based, with 39 of 51 listed funds recording lower net assets. The median fell 3.3%, and even the fund at the seventy-fifth percentile was slightly negative. This asset erosion predates Q1: At the end of 2025, listed funds had already posted a median net asset decline of 1.6% with 40 of 52 of entities shrinking, while non-traded funds grew a median 4.6%. Five funds account for 58.7% of the $2.84 billion of net asset declines recorded by the 39 listed funds that shrank, before offsetting by the 12 that grew.
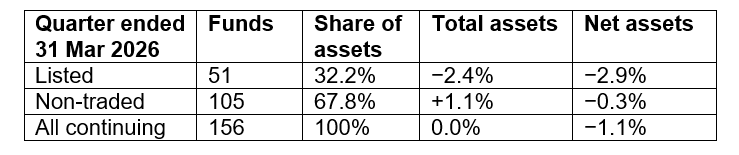
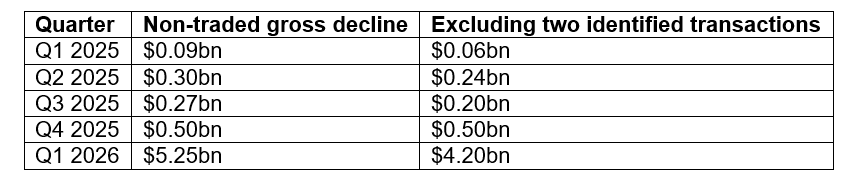
Among non-traded funds, the 0.3% decline in net assets masks a split as 63 funds grew net assets by an aggregate $4.66 billion, while 41 contracted by $5.25 billion (representing 2.6% of the $198 billion of net assets held by all 105 non-traded continuing funds at the start of the quarter). The Q1 decline was concentrated among the largest perpetual vehicles. In fact, the net asset reduction at the largest non-traded BDC during the quarter exceeded the total change for all listed BDCs.
The downtrend in non-traded assets holds even after widely followed investor liquidity-motivated transactions at two BDCs: one returned roughly 30% of net asset value to shareholders, funded by a $600 million sale of investments, following a terminated merger; the other met repurchase requests running at 40.4% of shares outstanding against a 5% quarterly cap. Excluding these two does not change the Q1 outcome or the inflection in non-traded BDC assets.
On a portfolio-cost basis the same gross decline amount to $1.92 billion versus $5.25 billion in net assets. The investment books held their size while equity left through distributions, repurchases and marks, which makes the quarter a capital structure event rather than a portfolio one.
Redemptions are captured in separate filings and not measurable in this dataset. Stable net assets for non-traded funds are therefore not evidence that redemption demand was stable.
Two Paths to Higher Leverage
Both the listed and non-traded segments arrived at higher effective leverage in Q1, albeit through different mechanisms. Comparing only funds that report both total assets and net assets at each end of the quarter, Non-traded funds added roughly $4.85 billion of liabilities while net assets fell slightly. Listed funds repaid roughly $1.91 billion in liabilities, but net assets fell faster still, increasing the ratio of total assets to net assets. Liabilities (total assets less net assets) consist largely of borrowings, but also captures payables for investments not settled and accrued incentive fees.

For both segments, the ratio of total assets to net assets finished Q1 at the highest levels in the available window. Non-traded funds increased leverage by borrowing against an equity base that had stopped growing while listed funds by shrinking equity faster than the asset portfolio. While non-traded fund liabilities grew by 2.7% in Q1, debt growth has slowed sharply from the preceding four quarters when borrowing rose between 7.1% to 13.8% per quarter.
Credit Conditions
Credit conditions weakened in the first quarter of 2026, but the move is showing up first in portfolio yield and position valuations rather than non-accrual classifications. Portfolio yields have compressed materially over time coincident with growth in the overall private credit sector. Q1 asset markdowns were broad based and similar for listed and non-traded funds. Position-level data show the share of debt below 90% of cost or on non-accrual status rising from 0.9% to 3.2%, with substantially more exposure migrating into stressed buckets than recovering. PIK share of income remains closer to the middle of the recent range.
Portfolio economics have compressed sharply. Median effective portfolio yield fell from 11.9% in Q2 2023, the earliest quarter for which it is computable, to 8.8% in Q1 2026 (n=35), while the median spread over three-month SOFR narrowed from roughly 6.7% to 5.2%. Measured against each fund's own history, 14 of the 24 funds with sufficient history are at their own lowest recorded yield, signaling a broad compression rather than an average pulled down by a few observations.
Payment-in-kind income in Q1 made up 6.2% of total investment income in aggregate and 5.0% at the median fund (n=92). Across the thirteen quarters the aggregate has run between 5.8% and 8.0% and the median fund's share between 4.5% and 5.4%. Unlike yields, PIK share is not at an extreme: 43 of 59 qualifying funds sit in the middle of their own historical range, though 11 are at a three-year high.
Non-accrual rates are modestly higher from a low base but informed by thin data. Structured disclosure of non-accrual status, covering investments on which a fund has stopped recognizing interest income, remains thin. Out of a panel of 132 to 179 funds per quarter, between 34 and 72 provide machine-readable non-accrual data. The largest listed funds do not appear to tag non-accrual aggregates. Working from this limited data, the median non-accrual rate at fair value of 0.8% in Q1 came in the lower half of its 13-quarter range, which runs from a 0.5% trough in Q1 2024 to 1.6% at the window start.
Across the 83 funds reporting the figure, investments still held were written down by $2.04 billion during the quarter — the largest quarterly write-down in the thirteen-quarter window. Write-downs here, or unrealized depreciation, represents the amount by which a fund reduced the carried value of investments it continued to hold during the quarter. As such, these represent valuation judgments rather than cash losses and may be reversible if marks recover.
Losses settled in the Q1, through sales and write-offs, totaled $225 million. (Losses are derived by subtracting the prior quarter running total from the measurement quarter, except in Q1 when the YTD figure aligns with a quarterly measurement. Eighty of the 83 observations in the write-down sample are such Q1 figures taken directly from the filing.)
While large non-traded BDCs contribute significantly to aggregate dollar write-downs, the differences between listed and non-traded were immaterial when scaling by portfolio size. Median Q1 unrealized depreciation as a share of total portfolio value at cost measured a roughly similar 0.8% for listed funds (n=20) and 0.7% for non-traded funds (n=52). The largest single contributor's management commentary on the quarter attributed write-downs to credit spread widening across the market rather than to borrower-specific credit deterioration.
Across 59 funds with comparable data in Q4 2025 and Q1 2026, the share of debt investments (portfolio holdings that carry a stated interest rate or spread, as distinct from equity investments) carried below 90% of cost or on non-accrual status rose from 0.9% to 3.2% in Q1. From a roll rate perspective, $3.86 billion of cost basis moved from performing into stressed marks and $0.65 billion from stressed into deep discount, against $0.53bn recovering, across 66 funds with matched positions.
On a sector basis, valuations appear more consistent than news may suggest. Where two or more funds hold the same borrower, their valuations agree to within roughly two-tenths of a percentage point of cost in 98 to 99% of cases. Disagreement is rare, confined to a handful of names, and dispersion tends to increase in stressed situations when valuation opinions may reasonably differ.
Disclosure Quality
While the SEC dataset is significantly helpful in providing a view of the entire BDC sector, the data is not without limitations. A primary constraint is whether machine-readable labels are consistent enough for systematic analysis. Amendments can duplicate records unless one authoritative filing is selected per fund-period; position identifiers are often missing; footnotes were frequently truncated, especially in Q1 2026; currency fields are structurally blank; subtotals and reported portfolio totals do not always line up; and tagging practices can change from quarter to quarter, causing otherwise valid funds to drop in and out of specific measures. The SEC dataset itself also contains occasional omissions, including one large fund missing for a quarter. All these issues are manageable, and quarterly financial reporting remains still highly valuable.
Conclusion
For the decade and a half after the financial crisis macro—calling the hikes, the cuts, the asset purchases, and the stimmies—became elevated in the investment and credit analysis framework. These interventions flattened performance within sectors and overshadowed fundamentals. In the new regime where benchmark rates are higher and yields less uniform, the BDC data illustrates the limitations of sector-level generalizations. Ranked by dollars, the largest write-downs of the quarter belong to the biggest funds, but ranked against the size of the portfolio being written down, none of the largest funds appears near the top. That list is led by funds a fiftieth their size, marking down 4% to 7% of their books.
Q2 earnings have already been filed and will reach the published data within weeks. Look for the data to clarify: (1) Whether the contraction in non-traded BDC assets continued; (2) Whether the decline in listed BDC assets that began at the end of 2025 extended; (3) Whether non-traded borrowing growth resumed at the 10 to 14% quarterly pace of 2025 or stayed near the first quarter's 2.7%; and (4) Whether a third quarter of position-level detail shows a recovery in valuations.
Appendix
Figures are drawn from XBRL data in filed 10-K and 10-Q reports as published in the Commission's BDC Data Sets. One filing is selected per fund per calendar quarter end, so amendments and superseded filings never contribute together. Facts are restricted to that filing, to the period-end date, to US dollars, and to reported values; an absent figure is treated as unknown, not zero. Quarter-over-quarter comparisons are computed on funds present in both quarters, and the fund count is stated wherever a comparison appears. A small number of funds report on an unconventional fiscal calendar and are excluded.
Portfolio positions are classified as debt investments where a stated interest rate or spread is present and the instrument description does not identify equity, warrants, structured products, government or money-market holdings, or interests in affiliated investment vehicles. Positions matching neither the debt nor the equity definition are counted and reported separately rather than assigned. Fund-level position data is reconciled against each fund's own reported schedule total, and fund-quarters outside a defined tolerance are excluded from pooled figures and flagged individually. Roughly a fifth of position cost carries no borrower identifier and is excluded from borrower-level figures.
Data for the largest non-traded BDC is absent for the quarter ended 30 June 2025 and was filled in from the Commission's company-facts service, which publishes the same registrant-tagged values through a different channel.