




New data from the Federal Reserve’s quarterly Financial Accounts of the United States clarifies the role of private credit in financing in the U.S. economy. For fund finance lenders, additional data on the size of the private credit market and the sources and use of capital will be welcome, although the U.S. focus is bound to frustrate some. The real value is the addition of private credit into widely used data sources for measuring debt financing to businesses next to bank and capital market sources, providing macro information that required triangulation in the past.
In its September release, the Fed added three new sectors for U.S.-domiciled private credit vehicles: private debt funds, business development companies, and interval and tender offer funds. Middle-market CLOs were also separated into their own category within the asset-backed securities. The release also introduced two new financial instrument categories: private credit loans and private debt fund interests, which the Fed labels “shares.” Also new in the release was the hedge fund sector and a new hedge fund shares instrument. Together, the additions provide an integrated framework for tracking private credit across borrower and investor balance sheets and for comparing it with other sources of business financing (with a U.S. nexus).
Jumping into the Data
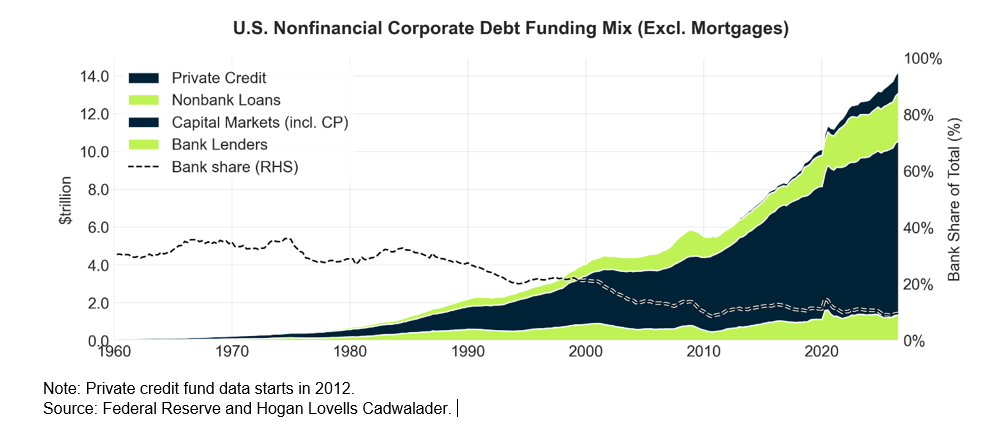
Debt of U.S. nonfinancial corporate businesses totals $14.23 trillion excluding mortgages. This broad business sector includes publicly traded and privately owned domestic corporations and accounts for roughly two-thirds of U.S. nonfinancial business debt. The role of banks in directly financing these businesses has been receding over time. Private credit loans account for 7.9% of debt financing, syndicated/institutional loans for 5.3%, and other nonbank loans for 12.6%, collectively well above the 9.6% sourced from bank balance sheets.
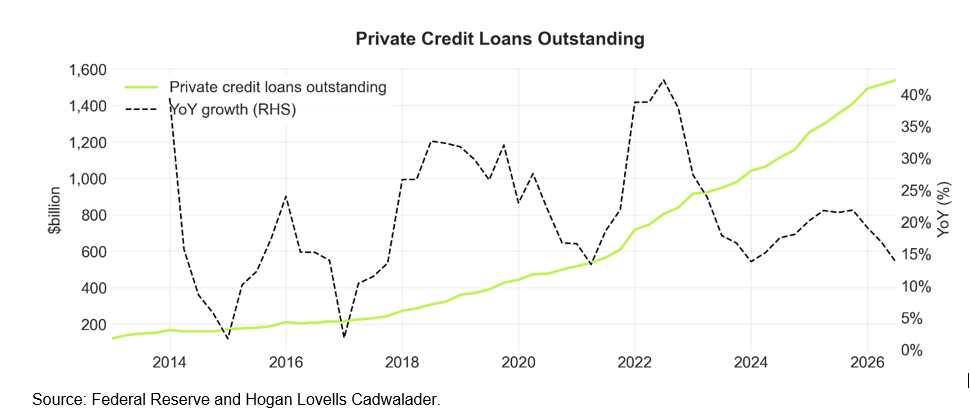
The U.S. private credit market measures $1.54 trillion, measured by loans held by U.S.-domiciled private debt funds, BDCs, interval/tender funds and middle-market CLOs, plus loans to U.S. borrowers from foreign-domiciled private debt funds and middle-market CLOs. The market has grown 7.4x over the past decade, driven principally by private debt fund loan holdings, which expanded 7.5x and accounted for 58% of the $1.33 trillion overall increase, followed by BDC loans, which grew 6.7x and contributed 30% of the increase, and middle-market CLO loan holdings, which rose 5.0x.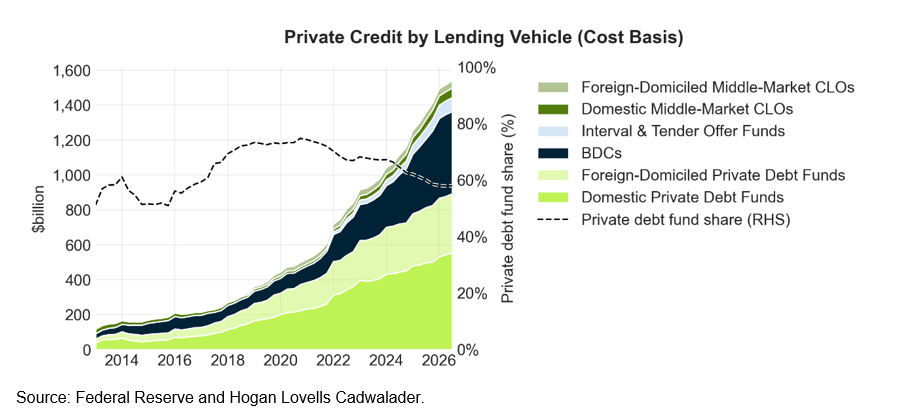
The Fed data provide an imperfect but useful read on private debt fund deployment, with the most notable shift occurring in 2022 as loan holdings increased 26% and deployment accelerated sharply into a low interest-rate environment. For 2026, the data point to continued fundraising momentum along with relatively efficient capital deployment: Dry powder rose 12% in the first half of 2026 to $345 billion, yet remains low relative to the size of the loan book compared with much of the prior decade. (Deriving a commitment-utilization ratio from the data is directional and imprecise because fund deployment is measured only in terms of private-credit loan assets rather than all invested fund capital, which may include securities and other assets.)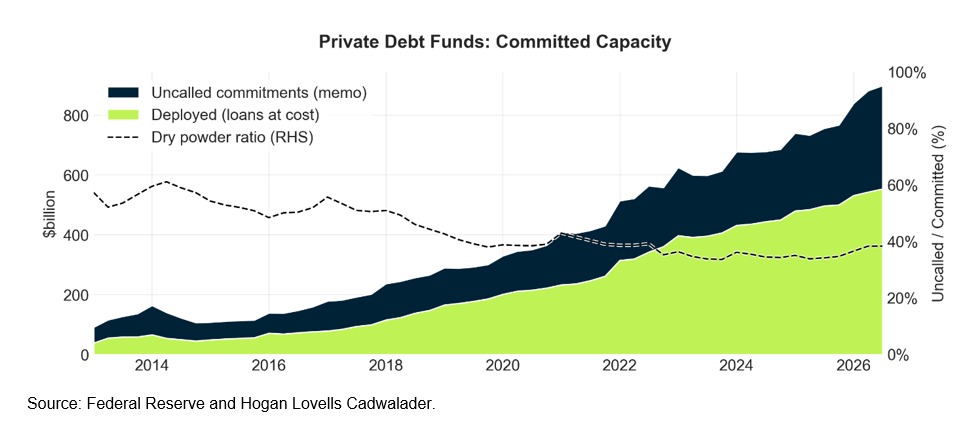
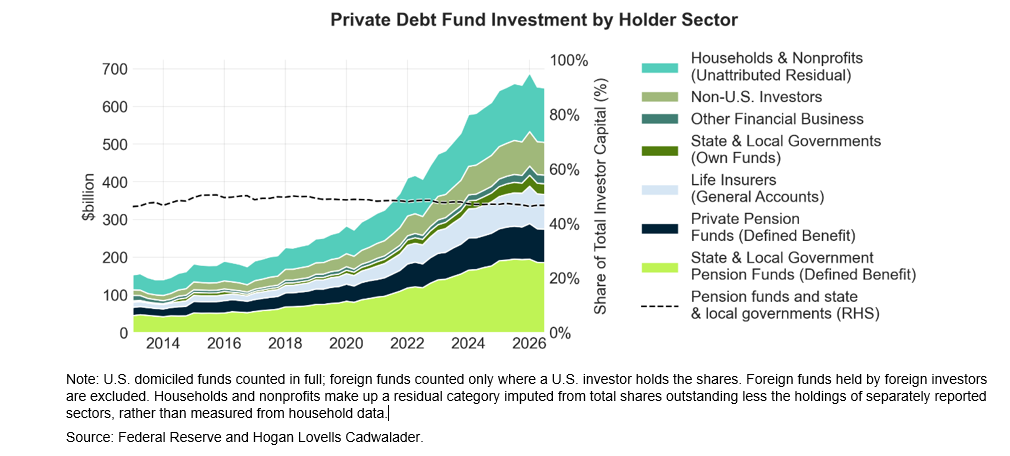
Among the broader private credit vehicles, investor information is limited and most clear for private debt funds, which includes U.S. domiciled and foreign funds where a U.S. investor holds an interest. Investment in these private debt funds totals $649.5 billion with retirement capital supplying the largest share of capital. State and local government defined benefit plans hold $186.0 billion (28.6%) and private defined benefit plans $88.7 billion (13.7%), together making up 42.3% of the total (rising to 46.7% with state and local governments' own funds). Life insurance company general accounts hold $92.1 billion (14.2%) and non-U.S. investors $86.8 billion (13.4%). Because investment data is not available for business development companies ($574.8 billion of assets) and interval and tender offer funds ($320.6 billion), the report doesn’t help with clear insight into household investment in private credit, and the available data skews toward institutional owners.
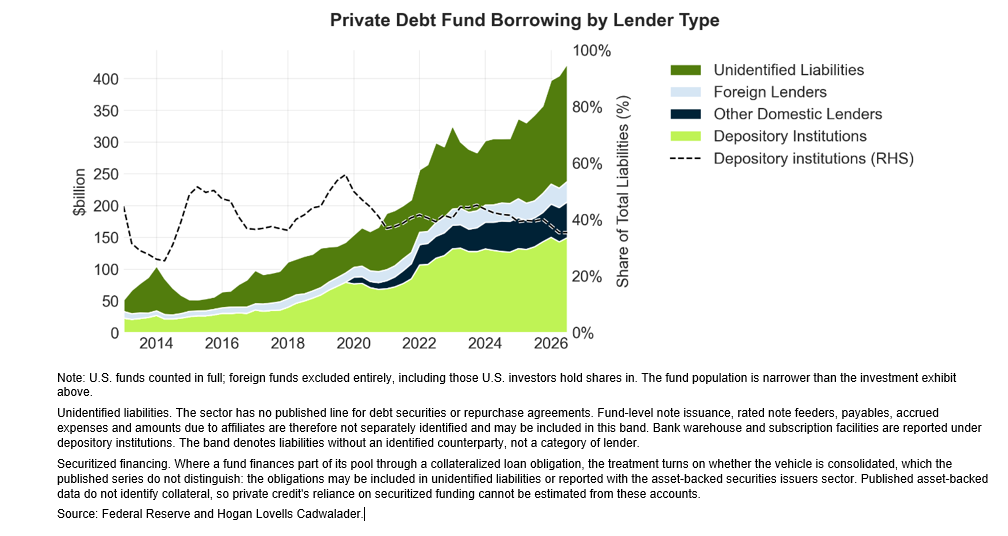
U.S.-domiciled private debt funds carry $423.7 billion of liabilities against $511.4 billion of investor equity and $935.0 billion of assets, translating to balance-sheet leverage of 45.3% of assets or 0.83x debt to equity. Debt rather than equity appears to be funding growth at the margin: liabilities expanded at an $80.0 billion annual rate in the second quarter against $1.7 billion of net new fund equity, with bank lending contributing $33.6 billion of that increase.
Data limitations are a factor here as well because $185.2 billion, or 43.7% of liabilities, is reported without an identified counterparty. The sector has no published series for debt securities or repurchase agreements, so fund-level note issuance and repo financing isn’t distinguished from payables and accruals.
Conclusion
While the past year has been a bumpy ride in private credit, the Fed’s aggregate data shows an industry that continues to grow at a double-digit annual rate with accelerated deployment into loans in 2026. The larger themes on the rising significance of private credit in financing the U.S. economy remain fully intact. Fund finance, therefore, continues to occupy a central place in intermediating a broader credit industry rearrangement in the roles of, and relationships between, traditional lenders and private credit funds.